Live Account Results · May 2026
EUR/USD Cent Account Posts +$4,936.80 Across 21 Consecutive Green Days
A full breakdown of May 2026 live trading performance — verified on Myfxbook, not simulated, not backtested.
Not every month in forex deserves a detailed write-up. May 2026 does. The EUR/USD live cent account produced results that go well beyond a strong headline number — the consistency, trade volume, and directional balance across the month tell a story worth understanding in full.
This is a structured review of the May 2026 performance data. Every figure below comes from the live trading report. The account can be independently verified on Myfxbook — the link is included throughout.
Performance SnapshotMay 2026 at a Glance
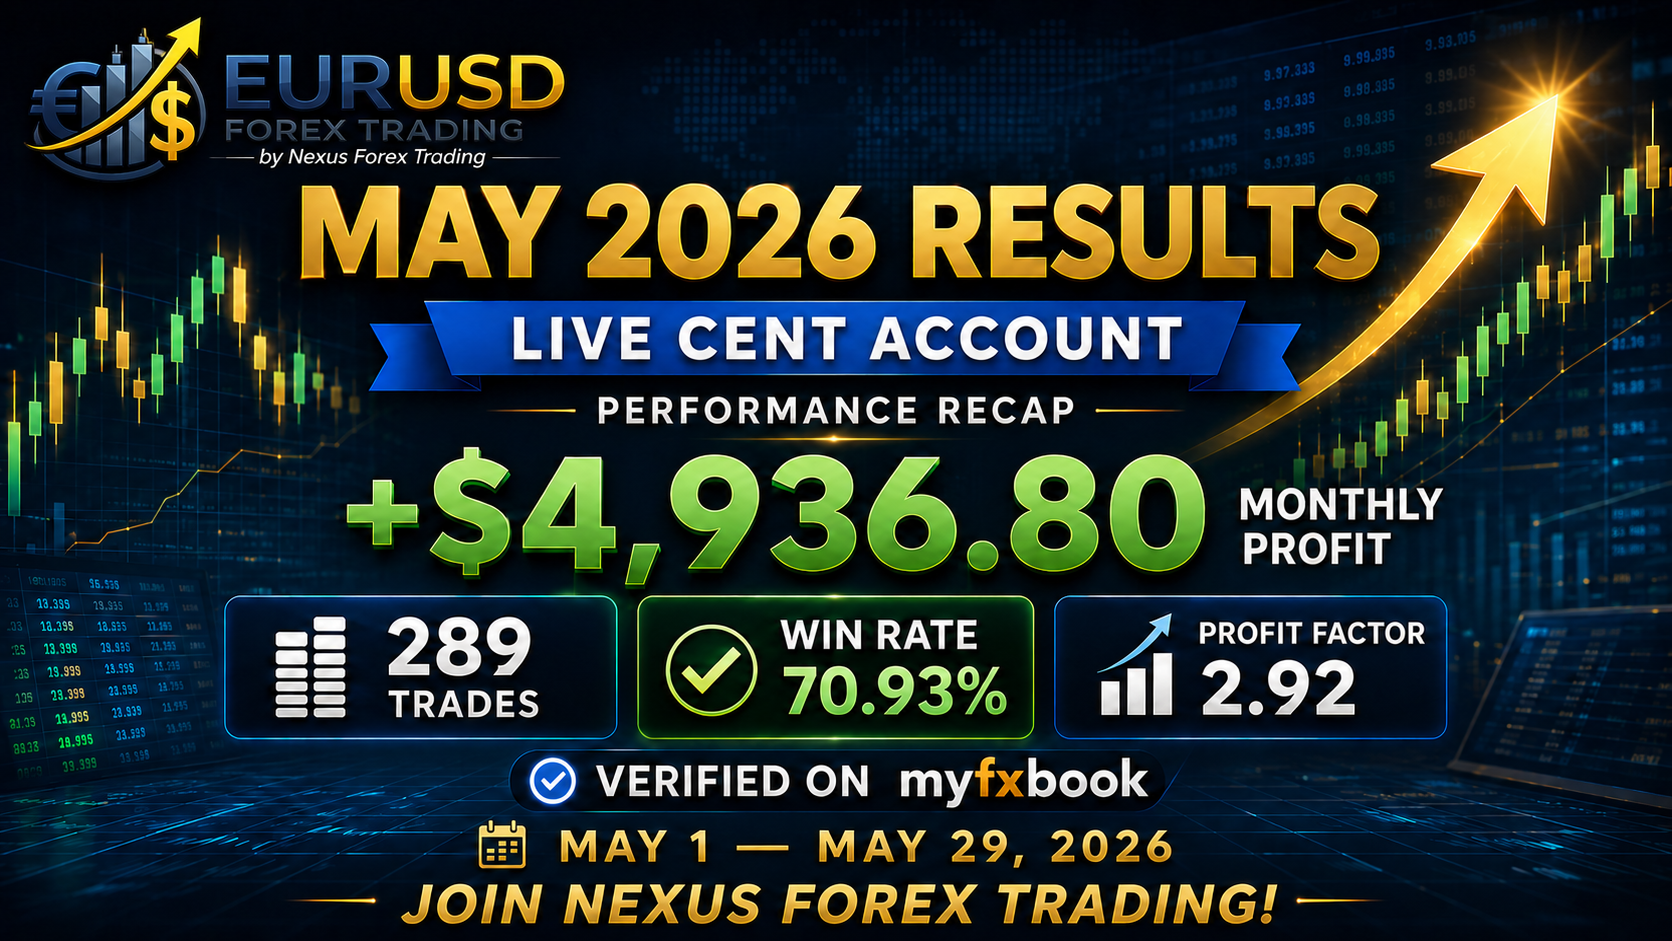
The headline figure is +$4,936.80, but the number that defines the quality of the month is the profit factor of 2.92. That means for every dollar lost, the account generated roughly three dollars in gross profit. Combined with a 70.93% win rate across 289 trades, May produced a performance profile that reflects both edge and execution.
Consistency Metric21 Out of 21 Green Trading Days
The single most compelling consistency figure from May is straightforward: every closed trading day in the month finished in profit. No red days. No recovery sessions needed. The account built its monthly total day by day, session by session.
The average daily profit across all 21 trading days was approximately +$235.09. Crucially, that figure was not distorted by one or two exceptional days pulling the average up while quiet sessions dragged it down. Even the softest day of the month closed positive.
| Date | Daily P&L | Relative Size |
|---|---|---|
| May 15, 2026 | +$1,198.94 | |
| May 12, 2026 | +$938.97 | |
| May 11, 2026 | +$791.03 | |
| May 6, 2026 | +$769.44 | |
| May 4, 2026 | +$223.50 | |
| May 22, 2026 (quietest) | +$16.16 |
Sample Size Matters289 Trades, 83 Losses — Still Strongly Positive
Many performance reports circulate with a small number of trades. Five trades at 100% is interesting but tells you almost nothing meaningful about a system's behaviour. May closed 289 trades — enough volume to draw genuine conclusions about how the strategy handles a full month of market conditions.
Of those 289 trades, 205 finished in profit, 83 closed at a loss, and one ended flat. That means more than one in four trades was a loser, and the account still finished the month up nearly $5,000. That is the practical argument for risk management over win-chasing.
The average winning trade (+$36.60) comfortably outweighed the average losing trade (−$30.92). The system did not need to eliminate losses to be profitable — it needed consistent positive expectancy, which the trade data confirms.
Directional BalanceProfitable on Both Buys and Sells
A system that only performs during trending markets — where trades run in one direction — carries hidden risk. When market conditions shift, single-direction strategies can underperform sharply. May's results show a more balanced picture.
↑ Buy Trades
↓ Sell Trades
Both directions contributed meaningfully to the month's result. Sell trades actually delivered a higher win rate (73.85% vs 68.55%), while buy trades generated the larger share of total profit. Neither side was a drag — both produced positive net results across strong trade samples.
Pair SpecialisationWhy EUR/USD Remains the Right Focus
One of the most common mistakes in retail forex is breadth without depth. Traders spread attention across EUR/USD, GBP/USD, gold, indices, and emerging market pairs — convinced that more markets means more opportunity. In practice, it usually means more noise and less consistent execution.
EUR/USD commands attention for sound structural reasons. It is the most heavily traded currency pair in the world, which translates to tighter spreads, deeper liquidity, cleaner order execution, and market behaviour that is more widely studied and documented than any other pair. Institutional flow, technical structure, and macroeconomic drivers all interact in a way that a focused systematic approach can work with rather than against.
May's results are a product of staying in one environment and letting a repeatable process do its work. 289 trades in EUR/USD, every single one of them in the same pair, with consistent risk parameters applied throughout.
Why It MattersLive Results vs Backtested Claims
The forex industry has no shortage of backtested equity curves that look exceptional. Backtests are useful as a starting point — they show how a strategy would theoretically have behaved given historical price data. But they do not account for what actually happens when real money is deployed.
Live trading involves spreads that widen during news events, slippage on fast-moving prices, variable broker execution quality, swap charges, and the full range of actual market volatility. No backtest can replicate these conditions exactly.
Every trade in the May 2026 report happened in real-time, in live market conditions, on a funded account. The Myfxbook verification link makes it possible for any trader to review the account history independently — not just take a screenshot at face value.
TakeawaysWhat May 2026 Actually Demonstrates
SummaryMay 2026: A Month That Holds Up to Scrutiny
+$4,936.80 net profit. 70.93% win rate. 2.92 profit factor. 289 live trades. 21 green trading days out of 21. Profitable on both long and short EUR/USD positions. Independently verifiable through Myfxbook.
What makes May worth documenting is not the profit number in isolation — it is what the supporting data shows about how that profit was generated. Through consistent daily execution, a controlled relationship between winning and losing trades, and an unwavering focus on a single major currency pair.
That is what structured EUR/USD trading can look like when a rules-based system is applied with discipline across a full month of live market conditions.
Get StartedReady to Approach EUR/USD More Systematically?
If emotional trading, inconsistent signals, or scattered strategy are holding your results back, a more structured, rules-based approach to EUR/USD could change how you trade.
Join EURUSDForexTrading.com Verify on MyfxbookRisk Disclaimer: Forex trading involves substantial risk of loss and is not suitable for all investors. Past performance — including the results presented in this article — is not indicative of future results. The May 2026 figures shown here represent historical live trading data and should not be interpreted as a guarantee or projection of future performance. Always trade with capital you can afford to lose and consider seeking independent financial advice before making any trading decisions.